
![]() Star Charts: Five types of charts are defined in
Scientific Astronomer, including two wide field star charts.
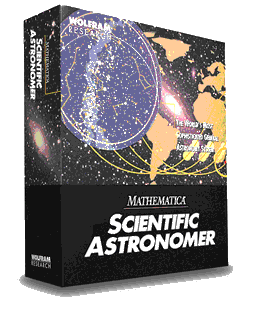
Star Charts: Five types of charts are defined in
Scientific Astronomer, including two wide field star charts.
 With the star charts you can zoom into any portion of the sky.
All the charts have options to show star spectral colors, mesh lines,
a sky line, the horizon line, the milky way, constellation labeling,
star labeling, planet labeling, deep sky labeling, and so on.
![]() Planet Plots: Planet plotting can be done in two- and
three-dimensional forms. Surface features for the Earth, the Moon,
Mars, and Jupiter are shown on the plots. Moons, and their shadows,
are displayed for the Earth and Jupiter. Related functions allow
you to produce planet position finder charts and planet rise/set
timing charts.
Planet Plots: Planet plotting can be done in two- and
three-dimensional forms. Surface features for the Earth, the Moon,
Mars, and Jupiter are shown on the plots. Moons, and their shadows,
are displayed for the Earth and Jupiter. Related functions allow
you to produce planet position finder charts and planet rise/set
timing charts.
![]() Eclipses: Several functions are provided for dealing with
eclipses. Both solar and lunar eclipses are handled, but the
functions are general enough to handle Galilean moon eclipses,
occultation of stars by the Moon, and transits of Mercury or
Venus across the solar disk. You can produce umbra and penumbra
track plots and perform eclipse prediction.
Eclipses: Several functions are provided for dealing with
eclipses. Both solar and lunar eclipses are handled, but the
functions are general enough to handle Galilean moon eclipses,
occultation of stars by the Moon, and transits of Mercury or
Venus across the solar disk. You can produce umbra and penumbra
track plots and perform eclipse prediction.
![]() Satellite Tracking: Satellite tracking is another feature of
Scientific Astronomer. You can create track plots, make
visibility predictions, and project satellite tracks onto star charts.
Satellite Tracking: Satellite tracking is another feature of
Scientific Astronomer. You can create track plots, make
visibility predictions, and project satellite tracks onto star charts.
![]() Miscellaneous: Miscellaneous other features are available,
such as producing planisphere plates, planet charts, and
solar system plots. In addition, sunrise, moonrise, and full moon
functions are provided, as well as functions for adding new objects,
such as comets and satellites.
Miscellaneous: Miscellaneous other features are available,
such as producing planisphere plates, planet charts, and
solar system plots. In addition, sunrise, moonrise, and full moon
functions are provided, as well as functions for adding new objects,
such as comets and satellites.
